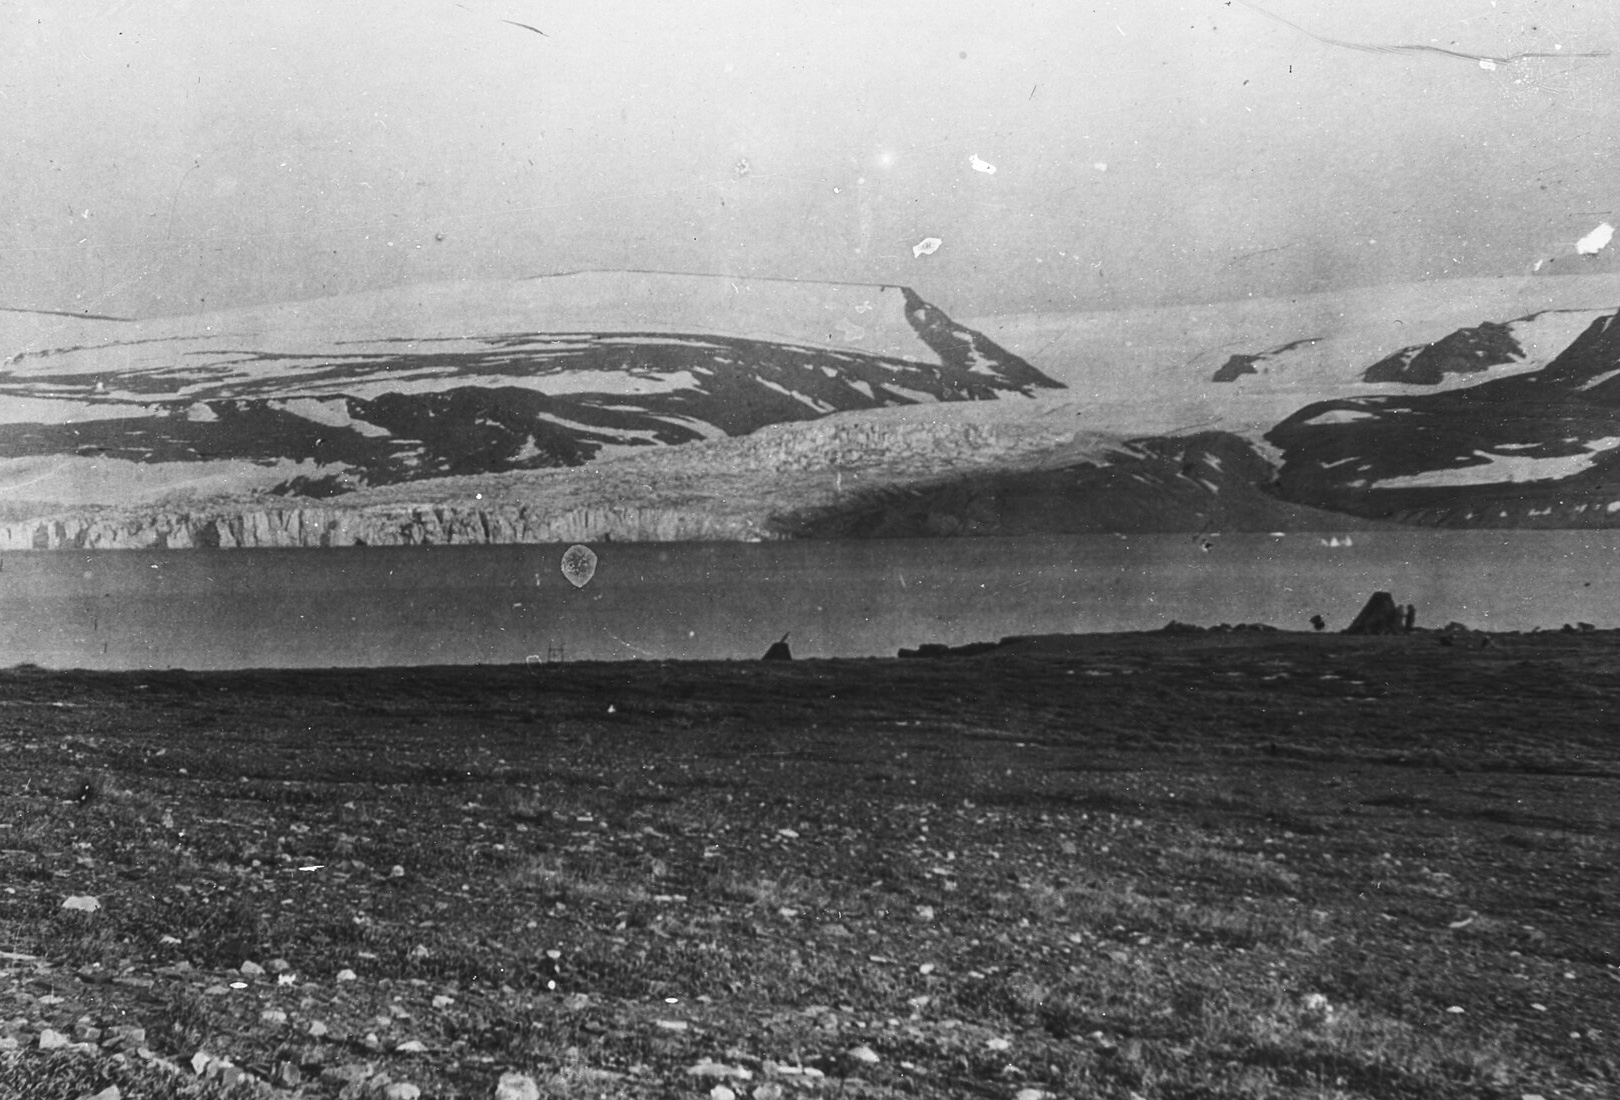
Nunatak Glacier seen from 450 feet above sea level, a lantern slide from 1905

45.9237° N
6.8694° E

Refugia scores any point on Earth for daily life, a long loss of power and modelled catastrophe, at the exact coordinates.

Where would youwait it out?

Named for the ground that held

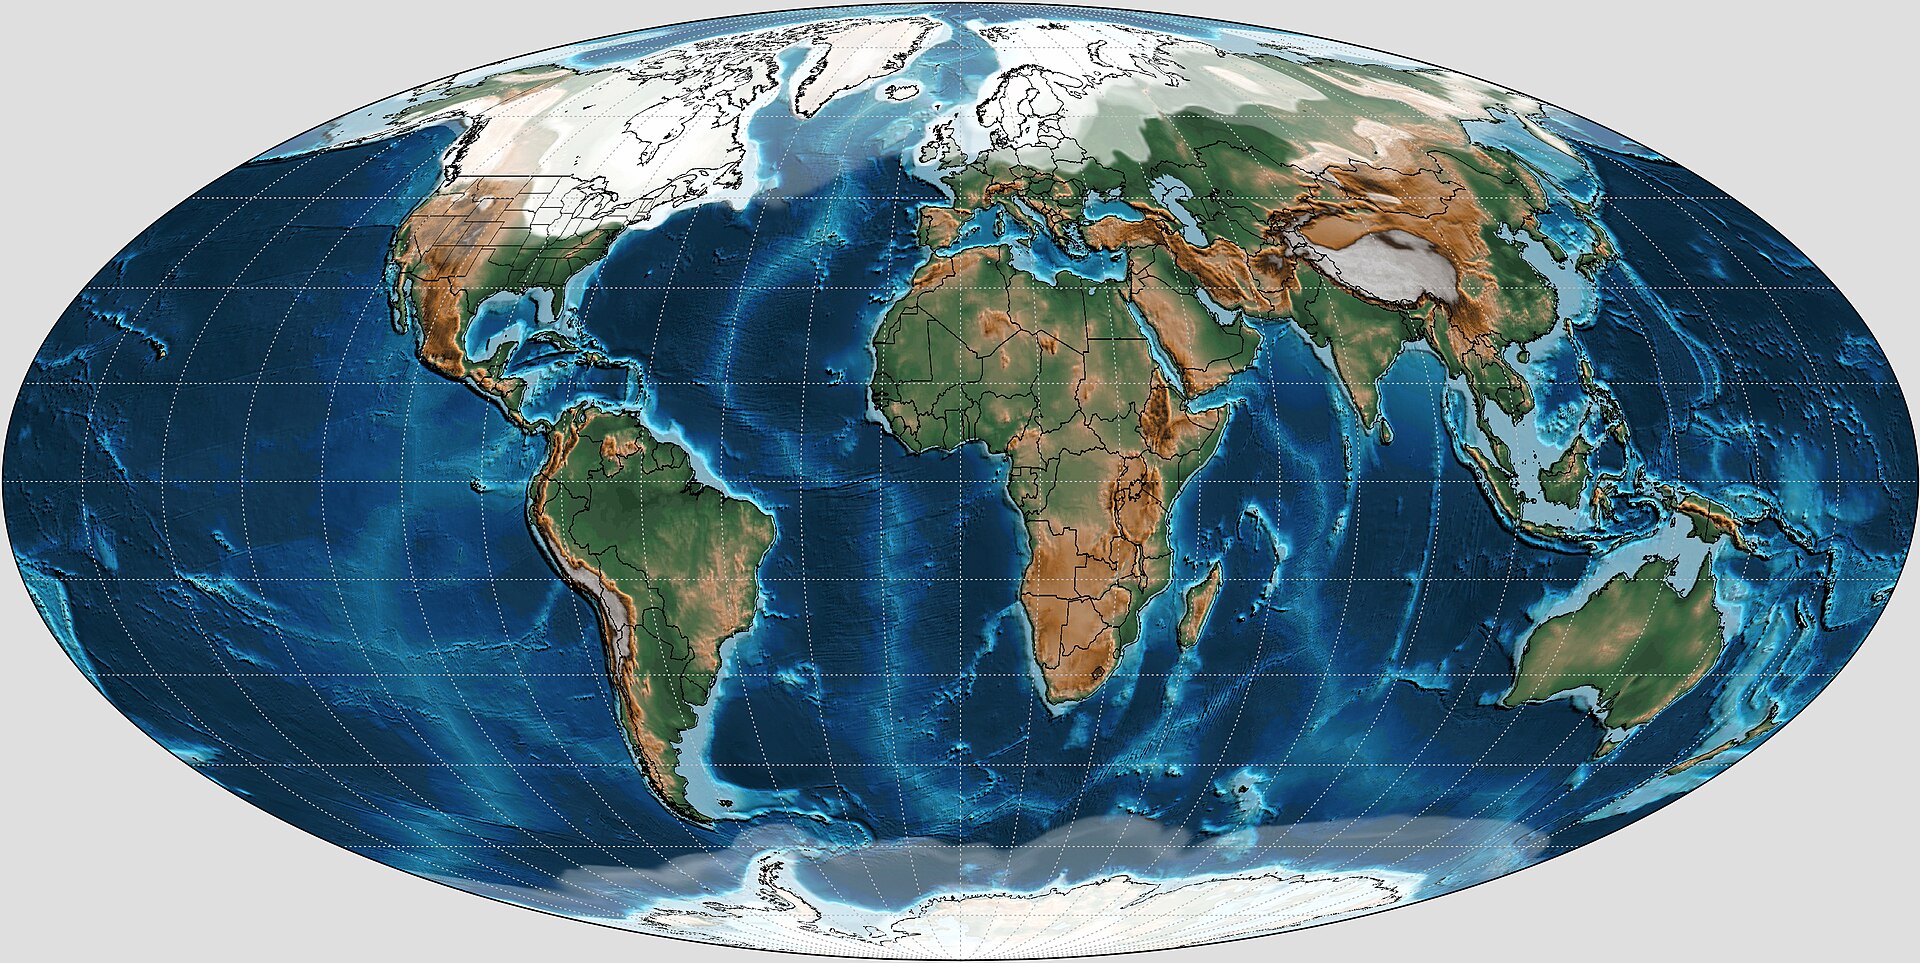
Twenty thousand years ago, ice covered much of the north. Life held on in refugia: valleys, coasts and peaks the ice never reached. Refugia finds out which ground holds when the world changes again.

Who it is for. People choosing land, a homestead or a second home they mean to rely on: off-grid builders, families leaving a city, anyone who prepares, and anyone who wants to know the ground before signing for it.

What you get. A private report on the exact coordinates. Fifty-two criteria in two layers, life today and life after a long loss of power, each scored from 0 to 100 with its evidence, its confidence and its sources.

Where it works. Anywhere on Earth. Global datasets cover every point, and regional ones take over where they exist, such as FEMA flood zones in the United States. Scenario layers model a nuclear exchange, ECDO and a micronova.

How to start. Drop a pin on the map or paste coordinates. A report costs six credits, about thirty dollars, and is ready in a few minutes. Credits never expire, and a failed report returns them.

Pick a place, read its report

Five points the engine has assessed. Each one answers differently once the grid fails or the world changes.

Refugia safety report

Chamonix

Auvergne-Rhône-Alpes, France

45.92370, 6.86940 · assessed 2026-10-24

74

of 100 overall

The same ground, four ways

  • Today78
  • Grid down70
  • Nuclear exchange64
  • ECDO70

Strongest categories

  • Environment87
  • Resources78
  • Positioning72
  • Self-Sufficiency69
  • Energy61
Elevation
1,040 m
To the coast
218 km
Rain a year
1,767 mm
Nearest volcano
302 km

26 data models ran for this point. Research agents add prices, crime, wells and rules.

From a pin to a report

Under a second

About two minutes

A few more minutes

  1. Under a second. First, the point is located and its country found.
  2. About two minutes. Then twenty-five data models measure terrain, floods, climate and hazards.
  3. A few more minutes. Last, research agents fill what no dataset holds, and an editor writes it up.

Every score shows its work

Galveston, Texas · Current

Event safety

76

ConfidenceHigh, 90%
  • Flood zone (FEMA)60Zone X, 0.2% annual chance · FEMA flood hazard layer50%
  • River flood, 100-year1000 m deep · Copernicus GloFAS20%
  • River flood, 10-year1000 m deep · Copernicus GloFAS16%
  • Deepest water within 300 m1000 m · Copernicus GloFAS8%
  • Coastal surge index330.62 of 1 · Derived from terrain and coast6%
  • Cyclone and tornado record: not measured yet

Fifteen sourcesof record

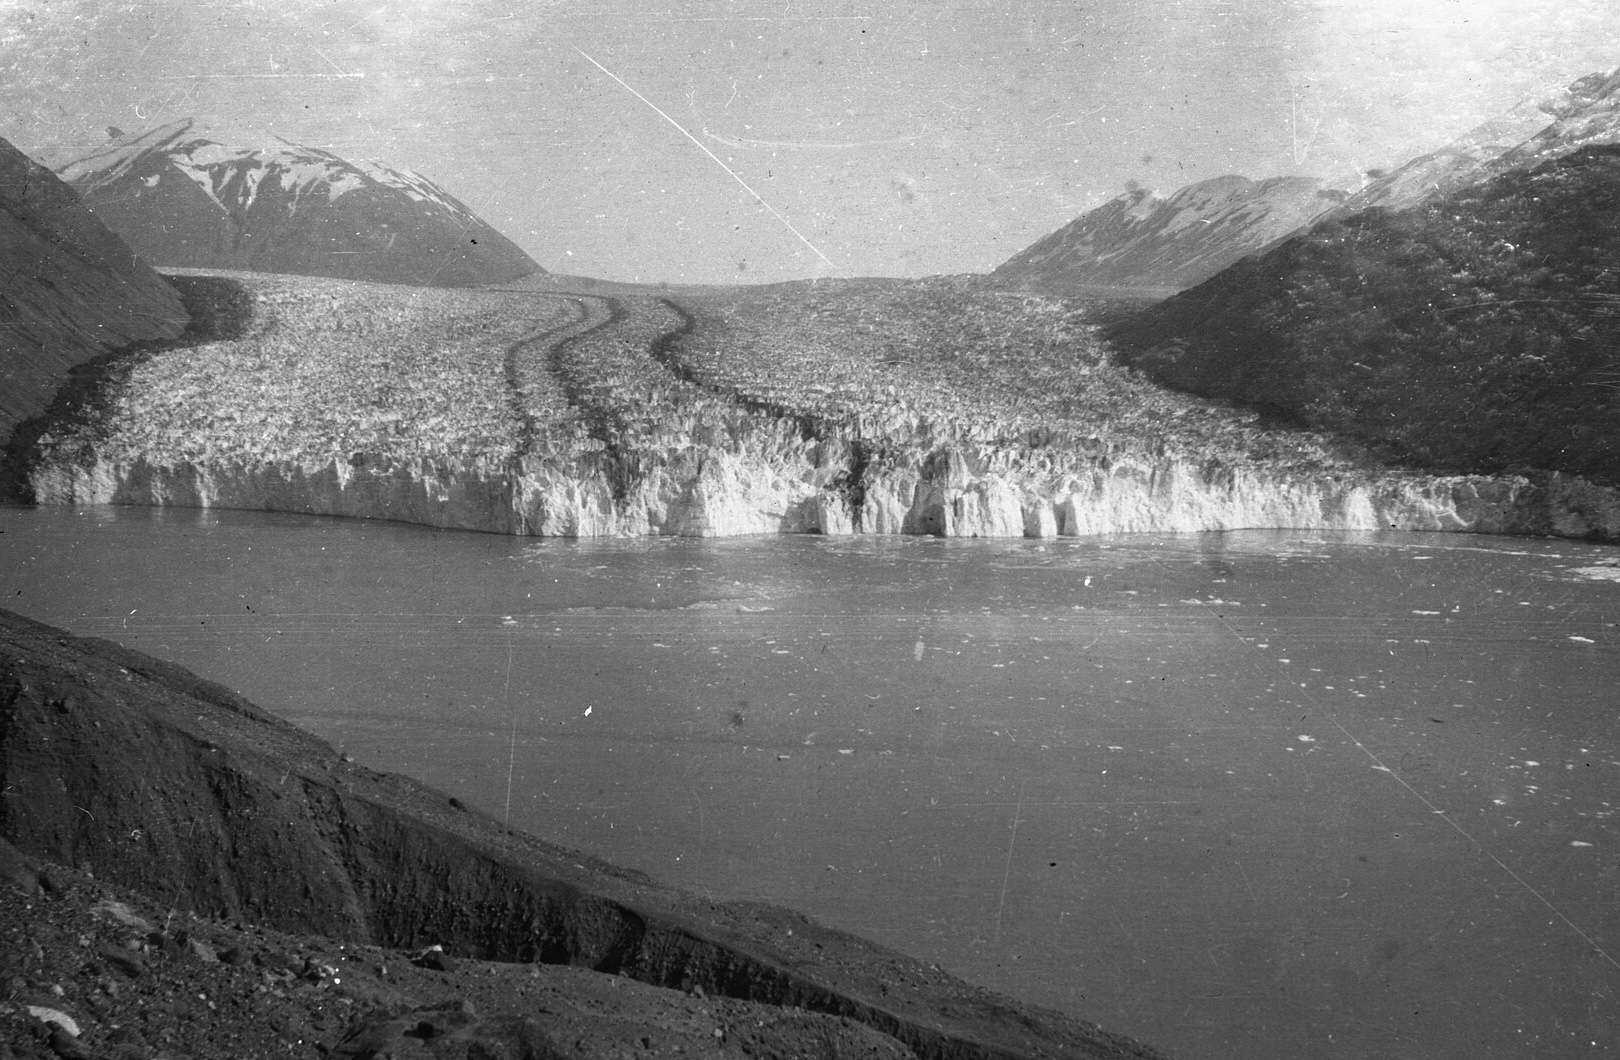
Tyndall Glacier meeting the sea, a lantern slide from 1899
Tyndall Glacier, 1899. Glaciologists then surveyed by hand what a satellite measures now.
Data sources behind every report
TerrainCopernicus GLO-3030 m
Land coverESA WorldCover10 m
River floodsCopernicus GloFAS90 m
Flood zones, USFEMA flood hazard layerparcel
ClimateERA5, 2014 to 20239 km
Sun and windNASA POWER55 km
SoilISRIC SoilGrids250 m
PopulationJRC Human Settlement1 km
EarthquakesUSGS cataloguesince 1975
FaultsGEM active faultsglobal
VolcanoesSmithsonian GVP1,214 systems
Power and reactorsWRI power plantsglobal
Toxic industryEPA TRI, E-PRTR, NPRI, NPI60,000 sites
Services and roadsOpenStreetMaplive
Live hazardsUSGS, GDACS, EONET, NOAAevery 10 min

Pay once, then keep watch

A report is six credits, thirty dollars, and each scenario adds two. A plan watches the places you choose and alerts you when the ground around them moves.

Steward

For a family with land, a cabin and somewhere to fall back to.

Watches fifteen places. Alerts for earthquakes, wildfires, floods, cyclones and geomagnetic storms nearby, an alert when any score changes, a quarterly refresh of each report, and four credits every month.

$29

a month

Choose Steward

Scout

For one plot you are still deciding on.

Watches three places with the same live hazard alerts, and includes one credit every month.

$9

a month

Choose Scout

Plain answers

Who sees my coordinates? Only you. A report is private to the account that ran it. The public map shows a generalised summary of a cell of about five square kilometres, never the point.

Is a score a prediction? No. Scores compare places on one absolute scale. They describe the ground and its exposure; they do not say what will happen there.

Why do some criteria say not measured? A score is only given where evidence exists. When a source has no data for a place, the criterion stays ungraded rather than guessed.

Where does the data come from? Fourteen open sources of record for terrain, floods, climate, soil, people, earthquakes, faults, volcanoes and infrastructure, plus research agents that cite every page they use.

What are the theoretical scenarios? Conditional models of a nuclear exchange, ECDO and a solar micronova, each run with its parameters stated. Refugia takes no position on whether any of them will occur.

How long does a report take? The data models finish in about two minutes. Research and writing add a few more. You can close the page; the report appears on your dashboard.

What if a report fails? Its credits go back to your balance automatically, and you can run it again.

Do credits expire? No. Buy them once and use them whenever you are ready.

What does an alert look like? A plain email and a dashboard entry: what happened, how far from your place, and a link to the source, such as a wildfire forty kilometres away.

Is this professional advice? No. It is a careful first read of a place. For a purchase, take it to a surveyor, an engineer or a lawyer.
Refugia. Coordinate-level resilience reports for any point on Earth.

Private by default. Exact coordinates are never published.

Scores compare places. They are not predictions and not professional advice.

Back to top

Pictures: "Nunatak Glacier- looking East 450 above sea tve lanternslide 0264" by Ralph Stockman Tarr, public domain · "Tyndall Glacier tve lanternslide 0181" by Ralph Stockman Tarr, public domain · "Map of Cornell Glacier, Lat. 74 degrees 10 minutes tve lanternslide 0086" by Ralph Stockman Tarr, public domain · "North Cornell Glacier, Greenland tve lanternslide 0090" by Ralph Stockman Tarr, public domain · "Mollweide Paleogeographic Map of Earth, 0Ma (Last Glacial Maximum)" by Scotese, Christopher R.; Vérard, Christian; Burgener, Lando…, CC BY 4.0 · "Tasman Glacier 360 digital elevation model topography" by TierraMagica (solast.io), CC BY 4.0. Via Wikimedia Commons.

Refugia, 2026